📖 The Problem: "When Volume Kills Visibility"
Modern distributed systems generate massive event streams continuously — payments, clicks, errors, user actions. Without dedicated infrastructure, these events vanish into unreadable logs or bury teams under thousands of unsorted alerts. Every signal's value drowns in the noise.
Zenith is the answer: a cloud-native Go pipeline that intercepts incoming events, evaluates each one against a set of dynamic business rules, and automatically triggers the right actions to the right recipients.
A concrete example:
If
purchase.amount > 500ANDuser.segment == 'VIP', trigger a high-priority Slack alert. Otherwise, silently archive to S3.
What sets Zenith apart from a basic webhook or a simple Kafka worker is its three-layer pipeline architecture with a dynamic JSONB rule engine, end-to-end observability via OpenTelemetry, and a reproducible cloud-native deployment on GCP.
🏗️ Architecture: 3-Layer Pipeline
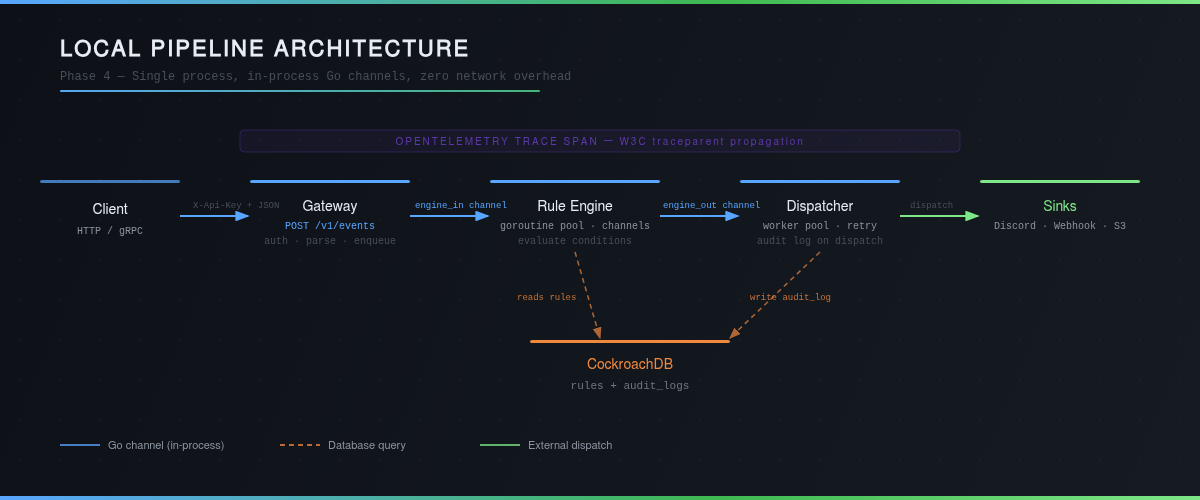
The pipeline follows a linear, non-blocking flow where each layer communicates with the next via in-process Go channels — zero network overhead.
1. Ingestor — The Entry Point
The ingestion service implements IngestorService via ConnectRPC, a layer that simultaneously exposes a native gRPC endpoint and a REST endpoint (HTTP/2 via h2c), with no additional configuration. Each incoming request is:
- Authenticated via
X-Api-Key(bcrypt hashing, key bound to aSource) - Validated and parsed into a
domain.Event - Enqueued into the
engine_inchannel toward the Rule Engine
A configurable goroutine pool (ENGINE_WORKER_COUNT, default 10) ensures ingestion never blocks, even under load.
2. Rule Engine — The Brain
The rule engine evaluates each event against all active rules linked to its source. Rules are stored as JSONB in CockroachDB, with a structured condition format:
{"field": "amount", "operator": ">", "value": 1000}
6 supported operators (==, !=, >, >=, <, <=) over dynamic types (numeric and string). Pure condition evaluation is zero-allocation on the hot path — 13.6 ns per evaluation measured in benchmarks.
Matched events are sent into the engine_out channel toward the Dispatcher.
3. Dispatcher — The Action Router
The Dispatcher orchestrates a worker pool that consumes matched events and routes them to the appropriate sinks (Discord, HTTP webhooks, S3). Each dispatch implements retry with exponential backoff and writes an audit_log record to CockroachDB — success or failure, every action is traceable.
Why Go Channels
Sub-millisecond latency (in-process channels). Planned evolution to NATS/Kafka for independent component scaling.
Choosing Go channels over an external queue is not a simplification — it's a deliberate architectural decision, latency takes priority over independent scalability.
🧠 Under the Hood: The Real Challenges
Challenge 1 — Graceful Shutdown Without Event Loss
A SIGTERM during evaluation can silently drop in-flight events. The solution is a complete, ordered pipeline drain:
SIGTERM received
  → Stop accepting (no new requests)
  → Drain engine_in (flush events waiting for evaluation)
  → Drain engine_out (flush matched events waiting for dispatch)
  → Clean exit
Goroutine coordination uses a context.Context with propagated cancellation — each stage waits for its input channel to close before stopping, guaranteeing no in-flight event is lost during a Kubernetes rolling deployment.
Challenge 2 — JSONB Rule Evaluation Without an ORM
Conditions are stored as json.RawMessage in CockroachDB. The evaluation engine (internal/engine/evaluator.go) dynamically decodes each condition and applies the operator on inferred types — no reflection, no allocation on the hot path.
Benchmark results:
- Pure condition (zero allocation): 13.6 ns per evaluation
- Full
Evaluator.Evaluate()(JSON + repo lookup): 3.2 µs - JSON unmarshal accounts for ~95% of the cost — the evaluation logic itself is negligible.
Challenge 3 — Integration Tests with testcontainers-go
Repository tests in internal/repository/postgres/ spin up a real CockroachDB instance via testcontainers-go, apply golang-migrate migrations, then run against a live database. Zero mocks, zero possible drift between test and production.
The rationale is defensible: unit tests with a mocked database hide migration bugs. Here, if the migration passes in CI, it passes in prod.
🔭 Observability: Tracing Every Event
OpenTelemetry — From Ingestion to Dispatch
Every event generates a complete span tree, propagated via the W3C traceparent header:
| Span | Key Attributes |
|---|---|
ingestor.gateway.handle (root) | event_id, source, event_type |
engine.evaluate_rules | source, total_rules, matched_count |
dispatcher.dispatch | rule_id, sink_type, status |
Traces are exported to GCP Cloud Trace in production (via OTLP), or to Jaeger locally (docker-compose included in deployments/monitoring/). W3C propagation allows correlating a client request with its dispatch action, across all pipeline components.
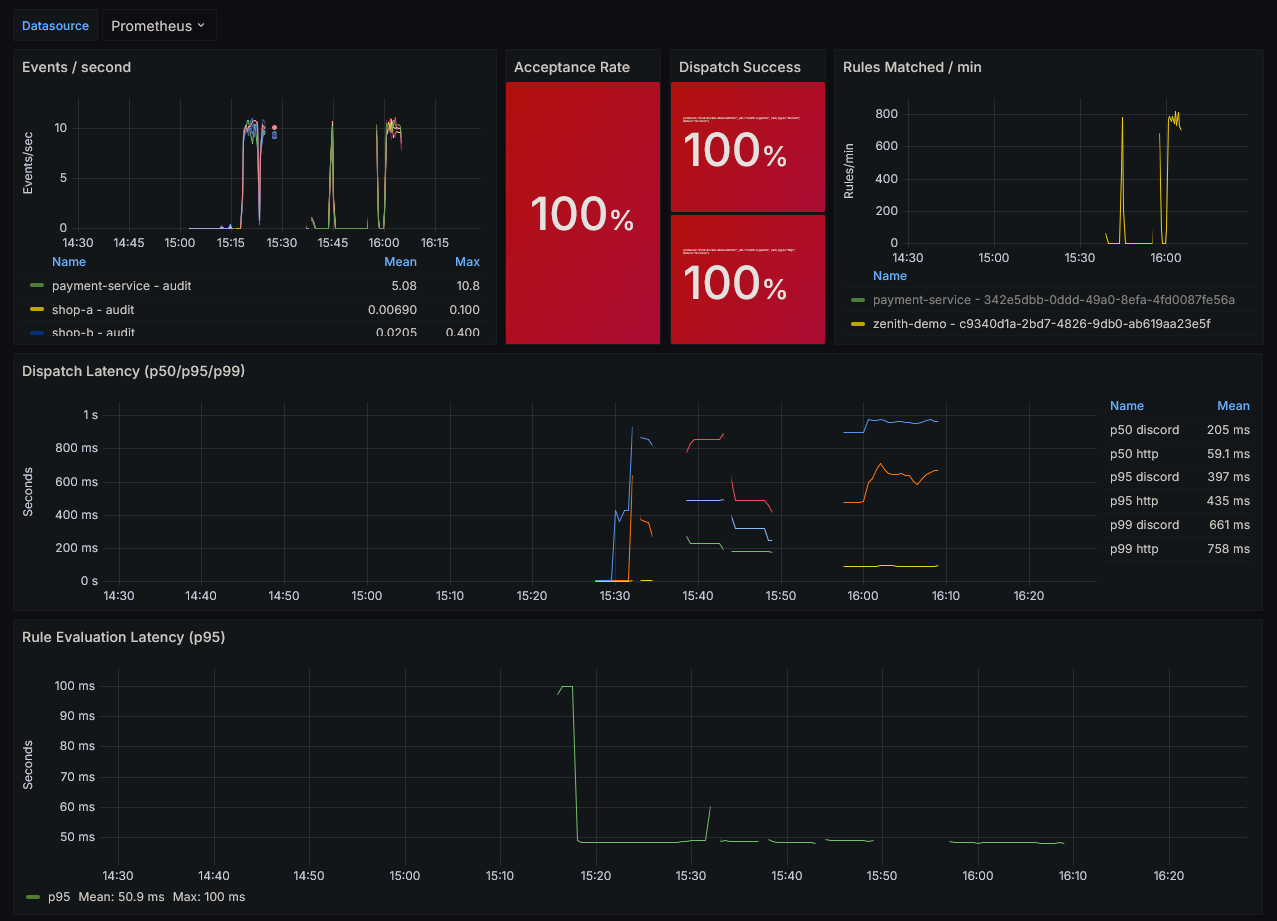
Prometheus — 9 Metrics, 3 Categories
| Category | Key Metrics |
|---|---|
| Ingestion | events_received_total, events_accepted_total, events_rejected_total (labels source, reason) |
| Evaluation | rules_evaluated_total, rules_matched_total, rule_evaluation_duration_seconds |
| Dispatch | dispatch_total (success/failed), dispatch_duration_seconds, worker_queue_depth |
The pre-built Grafana dashboard (deployments/grafana/zenith-dashboard.json) visualizes the entire pipeline in a single view: throughput, acceptance rate, dispatch success rate, p95/p99 latency, and live queue depth.
☁️ Infrastructure: Cloud-Native on GCP
| Component | Technology | Role |
|---|---|---|
| Runtime | Go 1.24 | Ingestor + Dispatcher binaries |
| Database | CockroachDB Serverless | ACID, distributed, PostgreSQL-compatible |
| Containers | Kubernetes (Kind local / GKE cloud) | Orchestration, HPA, resource limits |
| Cloud | Cloud Run + Artifact Registry | Scalable serverless deployment, git SHA-tagged images |
| Secrets | GCP Secret Manager | Secure injection of DATABASE_URL and API_KEY_SALT |
| CI/CD | GitHub Actions + Workload Identity | Keyless deployment, zero stored credentials |
| IaC | Terraform | Reproducible provisioning of the entire GCP infrastructure |
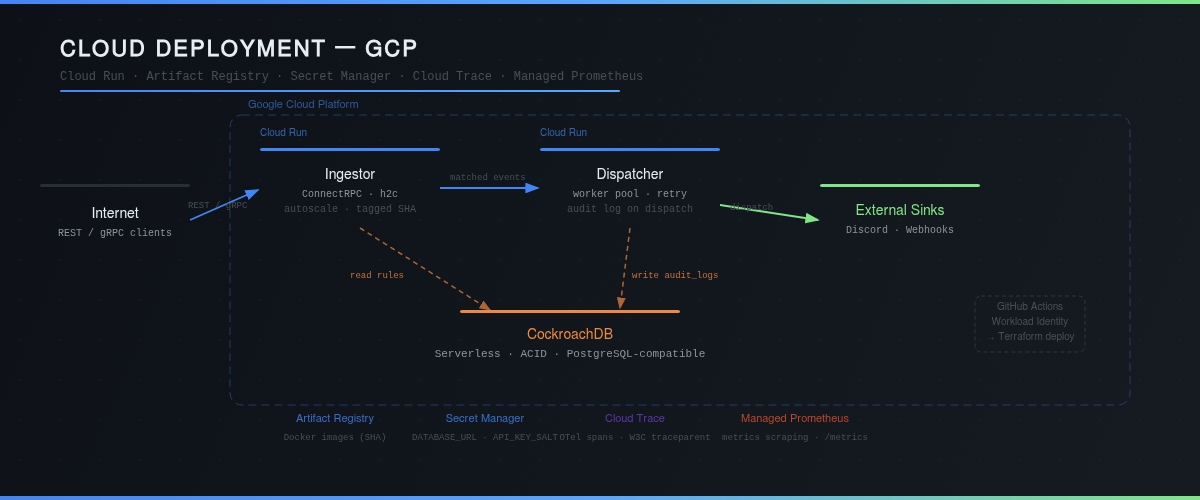
Credential-Free CI/CD
The GitHub Actions pipeline authenticates CI via Workload Identity Federation — no service account key is ever stored in GitHub secrets. CI calls Terraform directly with project_id and image_tag (git SHA); the rest is handled by Secret Manager on the GCP side.
HPA — Automatic Scaling Under Load
The Horizontal Pod Autoscaler is configured on the CPU metric (60% target), with min 1 / max 5 replicas. Under increasing load:
| RPS | CPU | Replicas | Status |
|---|---|---|---|
| 200 | 40% | 1 | Nominal |
| 400 | 65% | 2 | Scale-out triggered |
| 600 | 50% / pod | 3 | Rebalanced |
| 1000 | 45% / pod | 5 | Maximum capacity |
Time for a new replica to become operational: ~45 seconds (15s HPA check + 10s pod startup + readiness probe).
📊 Performance: The Numbers
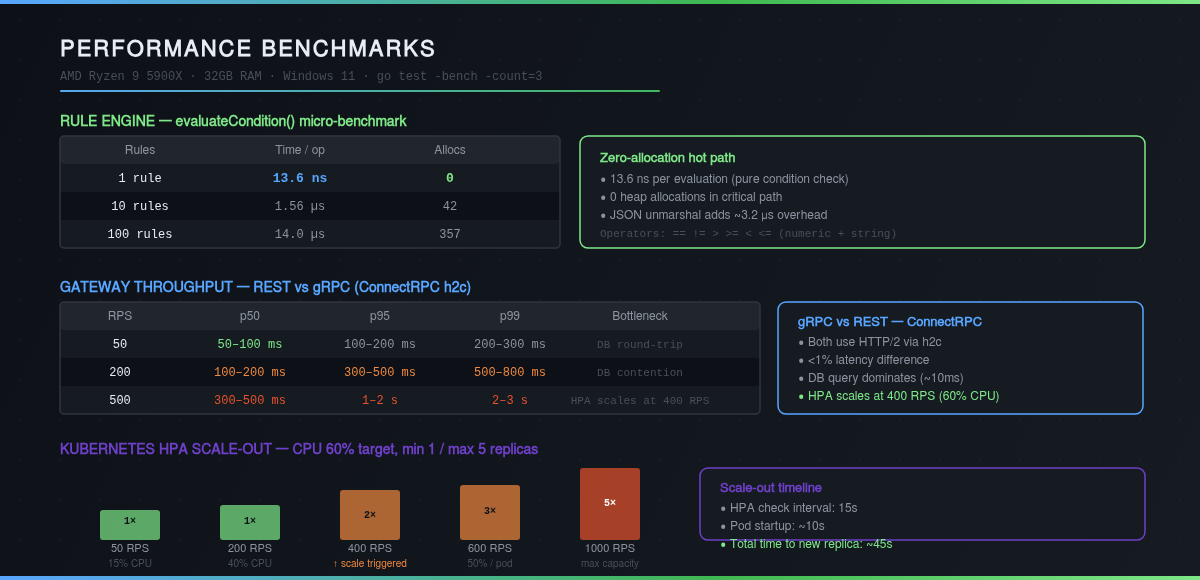
Rule Engine
| Measurement | Result | Allocations |
|---|---|---|
| Pure condition (1 rule) | 13.6 ns | 0 |
Full Evaluator.Evaluate() | 3.2 µs | 30 |
| 100 rules evaluated | 14.0 µs (condition) / 98.9 µs (full) | 357 / 1157 |
Zero allocation on the hot path means adding new operators or condition types won't degrade performance — the evaluation logic is fully decoupled from allocation cost.
Gateway
The real bottleneck isn't CPU — it's the CockroachDB round-trip (~10 ms) for ListBySourceID() on every event. At 50 RPS, p50 latency is 50–100 ms. HPA kicks in before queues saturate.
REST vs gRPC
Both protocols use HTTP/2 via h2c (ConnectRPC). The measured latency difference is < 1% — Protocol Buffers serialization cost is negligible against the database round-trip. The choice between REST and gRPC depends on client constraints, not server performance.
🚀 What's Next: & Message Broker
The current architecture couples the Ingestor and Rule Engine in a single process via channels. This is optimal for latency, but scaling ingestion also scales evaluation — the two components are linked.
Decoupling via message broker:
[Ingestor] → [NATS / Kafka / GCP Pub/Sub] → [Rule Engine] → [Dispatcher]
Tradeoff: +~100 ms latency (network hop + buffering) in exchange for fully independent horizontal scaling. Above a certain scale (>1000 sustained RPS), this tradeoff becomes obvious.
Other planned improvements: in-memory rule caching (eliminates the per-event DB round-trip), composite rules (AND/OR conditions), and multi-sink evaluation on a single event.
Technical expertise: Go (goroutines, channels, interfaces), ConnectRPC/gRPC, Protocol Buffers, CockroachDB, raw SQL (pgx/v5), OpenTelemetry, Prometheus, Grafana, Kubernetes (CKAD), Terraform, GCP (Cloud Run, Secret Manager, Cloud Trace, Artifact Registry, Workload Identity), GitHub Actions, testcontainers-go, Docker, golang-migrate.